54.4k views
0 votes
Imagine you have asked 1000 people how much they enjoy eating on a scale of 1-7. You have very skewed data, such that there are only outliers in the "negative" or left-hand side of the distribution. You decide to convert everyone's scores to z-scores. 1. After you convert the scores into z-scores, what would the shape of the distribution be? Explain your answer. Imagine you have ask the same 1000 people how much they enjoy running on a scale of 1-7. You have perfectly normal data. You decide to convert everyone's scores to z-scores. 2. Which z-score would be more probable, a z = -2.0 or a z = +0.5. Explain your answer.

1 Answer

4 votes

Answer:

Follows are the solution to this question:

Explanation:

Given that:

n=1000

Where the data is distorted and the bad outlier is just axed,when we transform scores of its distribution form into z-score, that become negative or skewed to the left. If n=1000 doesn't have normal skewed knowledge, then:

The data range is between 1 to 7
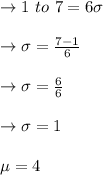

\to 1 \ to \ 7 = 6 \sigma \\\\\to \sigma =(7-1)/(6) \\\\\to \sigma = (6)/(6)\\\\\to \sigma = 1\\\\\mu = 4\\

In point (1):

The score that matches:


\to Z=-2 \ \ \ \mu -26 \\\\ \to 4-2 =2\\\\ \to Z_(score) =2

In point (2):

Its value of Z= 0.5 is
\mu \ \ to \ \ 5 \ \ \sigma


= 4+ 0.5 * 1\\\\= 4+ 0.5\\\\=4.5\\

User Adalle
by
6.8k points