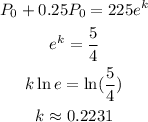
It is known that the population growth model is given by:

Initial population is 225 so P0=225 so it follows:

Each year the population will increase by 25% so it follows:

So the population function is:

The population in 5 years is given by:

Hence the population of trout will be 686.4960025 after 5 years which can be rounded to 687.