Find the slope of the line. That will give us the present price for each lunch.
Use the points (0,-150) and (50,0):

Then, the current profit equation is given by:

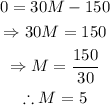
We want to change the price of each lunch so that the point (30,0) belongs to the graph (that means that when selling 30 lunches, it begins to make profit).
Let M be the new price. Then:

Therefore, the school should charge 5 dollars for each lunch.