The correlation coefficient is given by the formula:
x is the independent variable (number of girls) and y is the dependent variable (number of boys). With the shared values, let's find the terms of the formula, as follows:
n is the number of data, so n=9. By replacing these values into the formula, we obtain r:
![\begin{gathered} r=((9*2369)-(158*140))/(√([9*3448-(158)^2][9*2520-(140)^2])) \\ \\ r=(21321-22120)/(√([6068][3080])) \\ \\ r=(-799)/(4323.13) \\ \\ r\approx-0.18 \end{gathered}](https://img.qammunity.org/2023/formulas/mathematics/college/9l6reovi0kf7sdj730re7hjrvh4ibpkhk0.png)
The correlation coefficient is approximately -0.18.
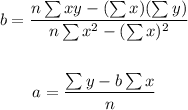
The equation of the line of best fit is given by:

Where b is the slope and a is the y-intercept. The formulas give these:

We calculated these values in the last step, so, let's replace them and solve for a and b:

Then, as y=boys and x=girls, then the line of best fit will be:

The answer is r=-0.18 and b=-0.13g+17.9