INFORMATION:
We have the following table that shows retail sales in drug stores in billions of dollars in the U.S. for years since 1995
We also have a linear model for the data

With the following scatter plot
And, we must solve the three questions.
STEP BY STEP EXPLANATION:
1.
To determine if the linear model fits the data well, we need to analyze the given scatter plot.
We can see that the blue points are very closed to the linear function, that means the function is a good model for the data.
2.
To estimate the retails sales in 2012, we must calculate which year is 2012 after 1995 and then replace it in the function.
So, we must subtract 1995 from 2012

Now, replacing t = 17 in the function

Then, in 2012 the retails sales were 245 billion of dollars
3.
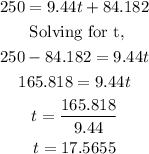
To predict the year that corresponds to retail sales of 250 billion, we must equal the function to 250, and then solve it for t.

Finally, to find the year we must add 17 to 1995 which is the first year

Then, the year that corresponds to retail sales of 250 billion is 2012
ANSWER:
1. the function is a good model for the data.
2. 245
3. 2012