170k views
2 votes
Sketch the graph of y = −x1/3. Identify the domain and the range.

Sketch the graph of y = −x1/3. Identify the domain and the range.-example-1
User Digikata
by
5.3k points

1 Answer

3 votes
Step-by-step explanation

Sketching the graph of the function

We can make a table of values to graph the function. For this, we can do the following steps.

Step 1: We make a two-column table and label the columns x and y.

Step 2: We choose several x-values and put them as separate rows in the x-column.

Step 3: We evaluate the function for each x-value.
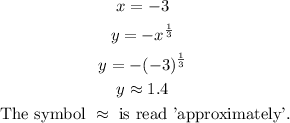

\begin{gathered} x=-3 \\ y=-x^{(1)/(3)} \\ y=-(-3)^{(1)/(3)} \\ y\approx1.4 \\ \text{ The symbol }\approx\text{ is read 'approximately'.} \end{gathered}
\begin{gathered} x=-1 \\ y=-x^{(1)/(3)} \\ y=-(-1)^{(1)/(3)} \\ y=1 \end{gathered}
\begin{gathered} x=0 \\ y=-x^{(1)/(3)} \\ y=-(0)^{(1)/(3)} \\ y=0 \end{gathered}
\begin{gathered} x=1 \\ y=-x^{(1)/(3)} \\ y=-(1)^{(1)/(3)} \\ y=-1 \end{gathered}
\begin{gathered} x=5 \\ y=-x^{(1)/(3)} \\ y=-(5)^{(1)/(3)} \\ y\approx-1.7 \end{gathered}

Step 4: We write the result in the y-column next to the x-value that we used.

Step 5: We plot and join each ordered pair (x,y).

Finding the domain and range of the function

Domain

The domain of a function is the set of all values for which the function is defined. In this case, there is no real number that makes the expression undefined. Thus, the domain of the function is the set of all real numbers.


\text{ Domain }=(-\infty,\infty)

Range

The range of a function is the set of all values that the function takes. In this case, the range of the function is also the set of all real numbers.


\text{ Range }=(-\infty,\infty)Answer

The graph of the function is:

The domain and range of the function are:


\begin{gathered} \text{ Domain }=(-\infty,\infty) \\ \text{Range }=(-\infty,\infty) \end{gathered}

Sketch the graph of y = −x1/3. Identify the domain and the range.-example-1
Sketch the graph of y = −x1/3. Identify the domain and the range.-example-2
Sketch the graph of y = −x1/3. Identify the domain and the range.-example-3
Sketch the graph of y = −x1/3. Identify the domain and the range.-example-4
Sketch the graph of y = −x1/3. Identify the domain and the range.-example-5
User Matan Kadosh
by
5.8k points