Given the table:
Year Population(millions)
2010 37.3
2011 37.6
2012 38.0
2013 38.3
2014 38.6
2015 38.9
2016 39.2
2017 39.4
2018 39.5
2019 39.5
Let's answer the following.
(a) Let's build a regression model that bets fits this data.
Let t = 0 in 2010.
To build a regression model, apply the formula:
y = mx + b
where m is the slope and b is the y-intercept of the regresion line.
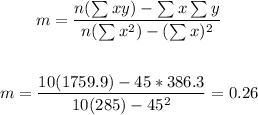
To find the slope, m, apply the formula:

Since t = 0 in 2010, we have:
t = 1 in 2011
t = 2 in 2012
t = 3 in 2013
t = 4 in 2014
t = 5 in 2015
t = 6 in 2016
t = 7 in 2017'
t = 8 in 2018
t = 9 in 2019


Thus, to find the slope, we have:
Where n is the number of data = 10

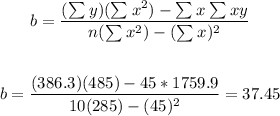
To find the y-intercept, we have:

Therefore, the regression model that best fits this data is:

(b) To find the population of the model in 2025, substitute 15 for t and evalaute:
t = 15 in 2025

Therefore, the population in 2025 will be 41.35 million people.
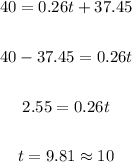
(c) When the model predicts the population will reach 40 million.
Substitute 40 for Pt and find t:

When t = 10, the year is 2020.
Therefore, the model predicts the population will reach 40 million by 2020.