Answer:
53
a. Graph of equation attached
b.
Domain:

Interval notation:

Range:

Interval notation:

c. See explanation below and on attached graph
d. See explanation below
Explanation:
53
The function to be used for answering questions is

a. Graph
Graph is plotted using online graphing tool. 2 points identified are (-4, 9) and (-3, 3)
b. Domain and Range
First let's understand what domain and range are
Definition of domain
The domain of a function, y = f(x), is the set of input(x) values for which the function is real and defined
The function has no undefined points nor domain constraints. You can see that the graph goes to infinity for negative and positive x values Therefore, the domain is :

which can be expressed in interval notation as:

Definition of range
The range of a function y = f(x) is the set of values for y over the domain for which the function is defined
As
 ,
,

y never quite reaches 0 but its value approaches 1 and therefore the range is

In interval notation:

c. End Behavior
The end behavior of a function f(x) refers to how the function behaves when the variable x increases or decreases without bound. In other words, the end behavior describes the ultimate trend in the graph of f(x) as

In this particular function we see that as

and as

d. Point (-3, 3)
By pure chance I chose this point as one of the points asked for in part a because I was looking for integer values I don't think it matters that there is repetition
(-3, 3) is plotted on the graph as point A
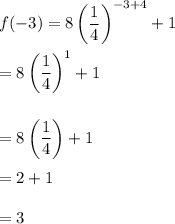
3. Evaluate f(-3)
We have

To find f(-3) substitute -3 for x in the above function:

So f(-3) = 3