128k views
2 votes
Use the graph of the function f to determine the given limit.
Picture below

Use the graph of the function f to determine the given limit. Picture below-example-1
User Bess
by
5.9k points

1 Answer

3 votes

Answer:

Option: a is correct.

Limit of the function at x=2 is: 2

Explanation:

Clearly by looking at the graph of the function we could observe that the function f(x) is defined as:

f(x)= -x+4 when x≠4

and 8 when x=2

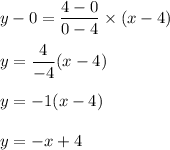
since we could see that the function f(x) is a line segment that passes through the point (4,0) and (0,4).

and the equation of line passing through two points (a,b) and (c,d) is given by:


y-b=(d-b)/(c-a)* (x-a)

Here a,b)=(4,0) and (c,d)=(0,4)

Hence,

the equation of line is:


y-0=(4-0)/(0-4)* (x-4)\\\\y=(4)/(-4)\tmes (x-4)\\\\y=-1(x-4)\\\\y=-x+4

Now the left hand limit of the function at x=2 is:


\lim_(h \to 0) f(2-h)\\\\= \lim_(h \to 0) -(2-h)+4\\ \\=\lim_(h \to 0) -2+h+4\\\\=\lim_(h \to 0)2+h\\\\=2

Similarly the right hand limit of the function at x=2 is:


\lim_(h \to 0) f(2+h)\\\\= \lim_(h \to 0) -(2+h)+4\\ \\=\lim_(h \to 0) -2-h+4\\\\=\lim_(h \to 0)2-h\\\\=2

Hence, the limit of the function at x=2 is:

2

User Aron Karmer
by
6.7k points
Welcome to QAmmunity.org, where you can ask questions and receive answers from other members of our community.