9514 1404 393
Answer:
Explanation:
Occasionally, you're asked about limits at some point where a function is continuous. At such a point, the limit is simply the value of the function.
__
Here, you're asked about limits at values of x where the function has discontinuities. That is, you must lift your pencil when you draw the function graph through that area.
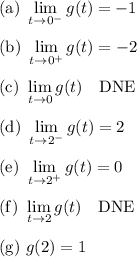
The limit from the left (indicated by a superscript minus sign) is the point you end up at when you follow the graph left to right to the x-value of interest. In this graph, the left-limit at x=0 is -1, and the left-limit at x=2 is +2.
The limit from the right (indicated by a superscript plus sign) is the point you end up at when you follow the graph right to left to the x-value of interest. In this graph the right-limit at x=2 is 0, and the right-limit at x=0 is -2.
When the left- and right-limits are the same, the limit is said to exist. When they are different, we say the limit does not exist.
A function is "continuous" at a point if (a) the limit at that point exists (left- and right-limits are the same), and (b) the function is defined at that point to be the limit value.
Here, you will notice that the function value is the solid dot that is present on the vertical line where the discontinuity occurs. g(0) = -1, g(2) = 1.
__
With these things in mind, we can answer the questions as follows:
