Step-by-step explanation


Step 1
a)The domain of a function is the set of its possible inputs and the range of a function is the complete set of all possible resulting values of the dependent variable (y, usually)
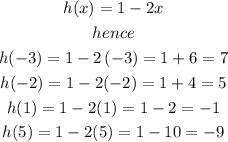
so, to find the range input each value from the domain to obtain its image
so

therefore, the range is

Step 2
graph the function
to plot the function just locate and mark each coordiante

I hope this helps you
.